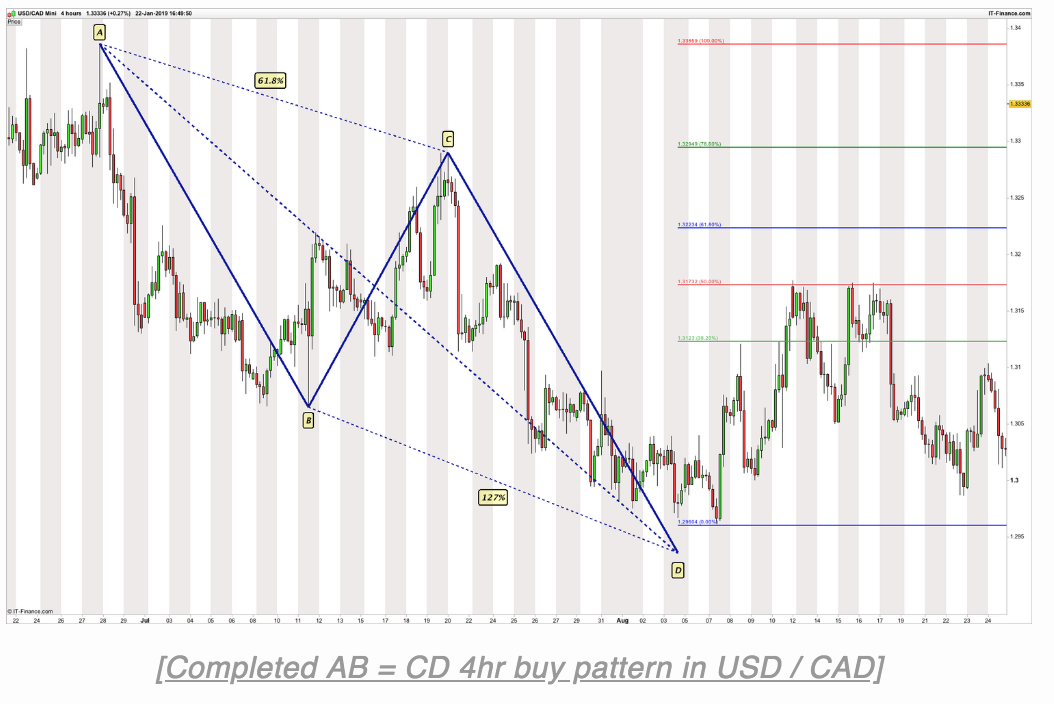
AB=CD
This is a pattern where both impulse waves are equal. It is quite common to find and easy to recognise, and it is one of the most powerful patterns in trading. The retracement wave between both legs can vary from 0.382 to 0.786, although in a strongly trending market it doesn’t usually go much further than a 38.2 retracement.
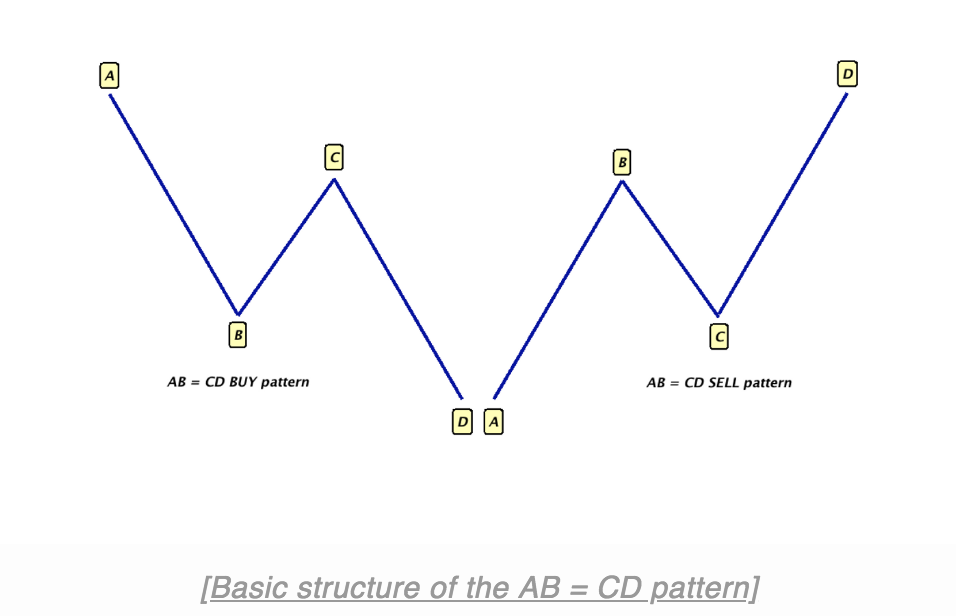
The basic characteristics of this pattern are as follows:
-Both AB and CD must equal.
-The retracement cannot go further than the price of the starting point which means that the price can not retrace more than 100%.
-Point D has to be higher than point B on a bullish move or lower on a bearish move for the pattern to be valid.
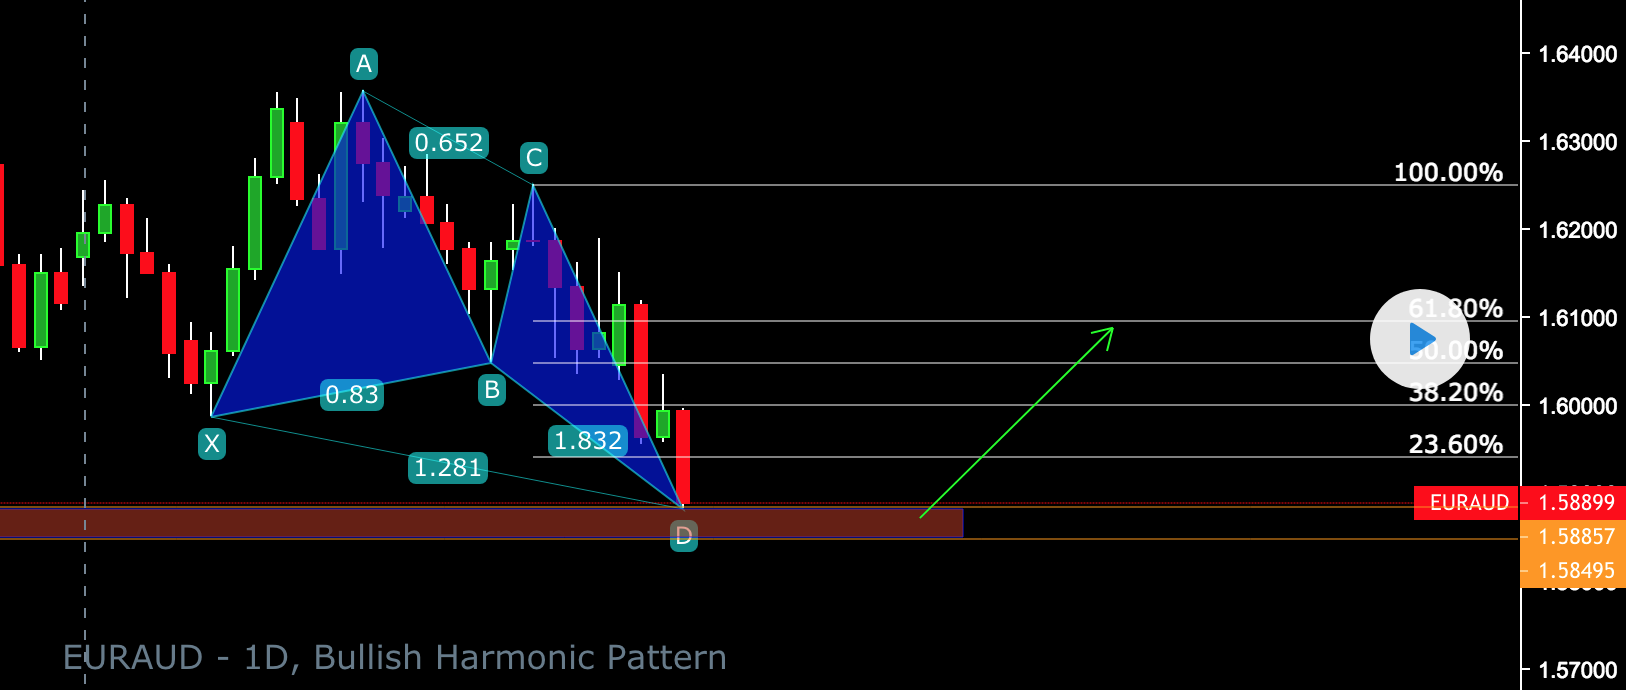
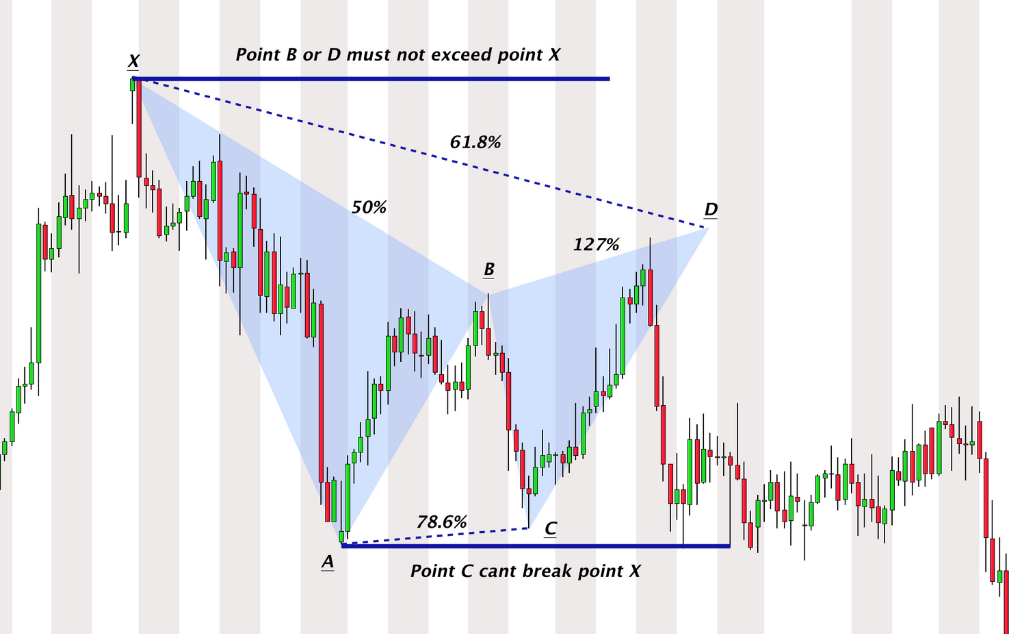
Butterfly
In the butterfly pattern, the first corrective wave from A to B is a deep retracement to 0.786, or 78.6%, of the move from the starting point 0 to A. If this happens, the second corrective move from C to D would have to reach 1.272 percent retracement of the first impulse wave from 0 to A. In this pattern, the projections from point B to point C can vary, but the Fibonacci ratios relative to the first impulse wave from 0 to A are always formed at those price levels.
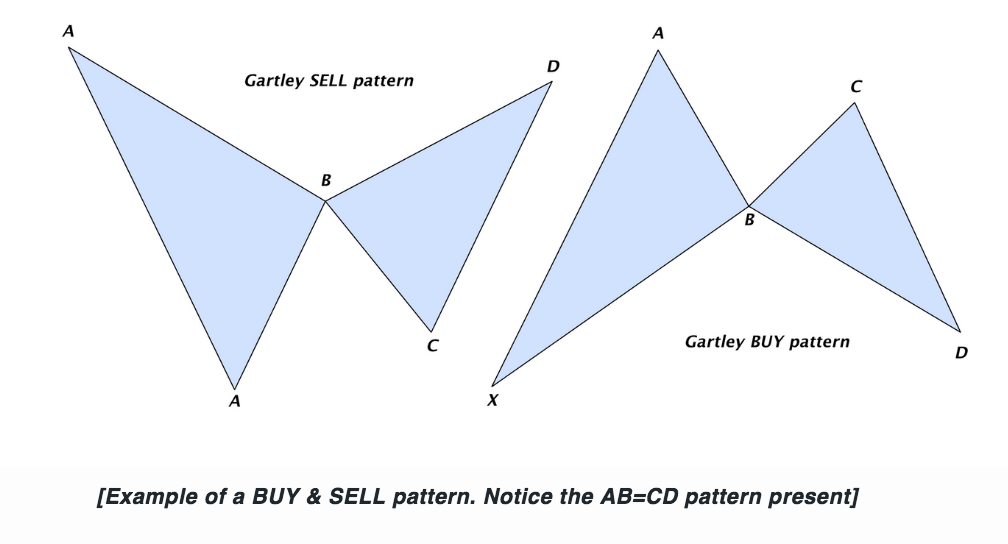
Gartley
This is an exact pattern where the first A-to-B corrective wave is always the 61.8 percent retracement of the move from 0 to A. The second corrective wave wave from C to D then should form at 0.786 of the move from 0 to A. Both corrective waves always will form precise at those levels.
Three Drives
This pattern consists of three consecutive impulse waves followed by a small correction. The noticeable aspect of this pattern is that each subsequent drive reaches either a 127.2 or a 161.8 percent Fibonacci retracement. In addition, each of the waves should form over equivalent time periods and be symmetric one to the other.
We cover these harmonic price patterns in a lot more detail in our online advanced course as one of our traders is an expert on this analysis.
You will also have access to our algorithm that we developed that is built around these price patterns on the stock market, once you have completed the course and joined our members education group.